With [Tuesday’s] release of PISA data it is once again time for wild punditry, mass condemnation of U.S. public schools and a renewed sense of urgency to ram through ill-conceived, destructive policies that will make our school system even more different from those breaking the curve on PISA.Graph of the Day: My contribution to PISA Palooza
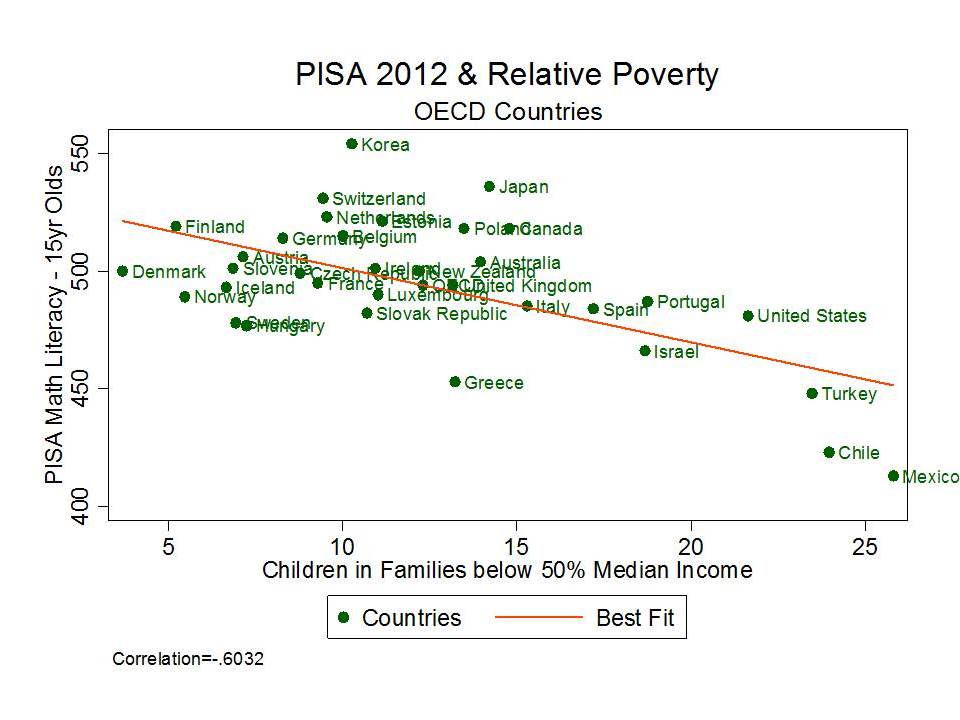
With that out of the way, here’s my little graphic contribution to what has become affectionately known to edu-pundit class as PISA-Palooza. Yep… it’s the ol’ poverty as an excuse graph – well, really it’s just the ol’ poverty in the aggregate just so happens to be pretty strongly associated with test scores in the aggregate – graph… but that’s nowhere near as catchy.
PISA Data: http://nces.ed.gov/pubs2014/2014024_tables.pdf
(table M4)
OECD Relative Poverty: Source: Provisional data from OECD Income distribution and poverty database (www.oecd.org/els/social/inequality).
Yep – that’s right… relative poverty – or the share of children in families below 50% of median income – is reasonably strongly associated with Math Literacy PISA scores. And this isn’t even a particularly good measure of actual economic deprivation. Rather, it’s the measure commonly used by OECD and readily available. Nonetheless, at the national aggregate, it serves as a pretty strong correlate of national average performance on PISA.
What our little graph tells us – albeit not really that meaningful – is that if we account (albeit poorly) for child poverty, the U.S. is actually beating the odds. Way to go? (but for that really high poverty rate).
Bottom line – economic conditions matter and simple rankings of countries by their PISA scores aren’t particularly insightful (and the above graph only marginally more insightful). Further, comparisons of cities in China to entire nations is a particularly silly approach.

Predictable PISA Results
The results of the 2012 Program for International Student Assessment should come as no surprise to anyone ("U.S. High-School Students Slip in Global Rankings," The Wall Street Journal, Dec. 3). They confirm what study after study has shown about the link between performance and poverty. Yet PISA will be used by privateers as evidence of the need to dismantle public education in this country. That's why I think it's worthwhile taking a closer look.
PISA is widely considered the most important of all tests of international competition because it measures whether students can apply their knowledge to real-life situations. This is all the more reason to put the results into proper context. The U.S. has the highest rate of childhood poverty in the industrialized world, according to UNICEF. Only Mexico is worse, but I hardly consider it to be industrialized. When more than 20 percent of children in the U.S. come from impoverished backgrounds, it's predictable that they will not perform as well as children from other countries.
The problem is seen in Education Department data. Poor children enter kindergarten already three months behind the average in reading and math, and never catch up. I understand why those who have never taught are frustrated. They point to the billions spent on public education and wonder why the dollars don't produce better test scores. It's a fair question. What they don't realize is that two-thirds of student achievement is the result of out-of-school factors ("Teachers Were Never The Problem," In These Times, Nov. 8). Teachers are not responsible for these conditions, and yet they are blamed when their students don't measure up.
There are two other points that are given short shrift by privateers. PISA was taken by about 6,000 randomly selected students from 161 public and private schools. I don't know exactly how many private students were included. But if private schools are the answer to educational quality, then why didn't their students increase U.S. scores on the latest PISA? The other point has to do with the inclusion for the first time of Massachusetts, Connecticut and Florida. It's interesting to note that students from Massachusetts and Connecticut did as well as or better than the averages of other countries. I say that because both states have relatively low household poverty rates. For example, Massachusetts has a poverty rate of 10.1 percent, ranking it 14th in the nation, and Connecticut has a poverty rate of 9.7 percent, ranking it 9th.
I want to emphasize once again that poverty is not destiny. There are heartening stories of public schools serving poor students that post impressive test scores. These high-flying schools deserve praise for their accomplishments. But they remain outliers. That doesn't mean their success cannot be duplicated by other public schools with similar student populations. However, I remain skeptical about the scalability.
The Meaning of PISA
So the top-performing countries move a little further ahead of us and the gap widens. In most OECD countries this news would be a call to arms. Their education leaders would be combing the PISA data on the top-performers to see what they could learn that might enable to them to improve their own performance. But not in the United States. Instead, in some kind of parallel universe, we are locked in education wars over policies none of which are likely to make any difference at all.
I agree with Diane Ravitch that all we achieve by attacking our teachers and promoting unworkable schemes to tie teacher's pay and retention to student performance on standardized tests is to make sure that we drive the best teachers away and ensure that the young people we want to attract to teaching careers will choose something else instead. But she seems to me to resolutely ignore the fact that the education system she champions has produced no improvement in education outcomes since the 1970s, while increasing the per pupil cost after accounting for inflation by 240 percent during that period. That is simply unsustainable.
I agree with Eric Hanushek and Paul Peterson that the inability of the United States to improve education outcomes while the cost of our schools skyrockets, even as one nation after another outperforms us on all indicators, poses a vital threat to the United States, but there is no evidence that the solutions they offer--charters, vouchers, accountability schemes designed to weed out bad teachers--will work, or indeed have worked anywhere at the scale of a state or nation.
I agree with the Silicon Valley entrepreneurs and Wall Street investment bankers that we should be encouraging new ideas and bold innovations, but I think their premise that we will succeed only by promoting "disruptive change" and blowing up the system is simply destructive. We need a system of mass education and they seem to be constitutionally averse to governmental systems of any kind. There is no solution down that road, because they offer us no road to a new system of mass education.
I agree with all those who believe that the Common Core State Standards are the last best chance this country has of setting the expectations of teachers, parents and students high enough for our students to succeed in an increasingly competitive world. But I sympathize with the teachers who say they have not been prepared for the changes that would be required to teach curriculum aligned to the Common Core well and I fear that those who insist that salvation lies in teacher accountability will saddle us with cheap tests because their system demands year-by-year testing of students; cheap tests will sabotage the Common Core by making it impossible to test the kind of complex thinking skills that the Common Core calls for.
The education wars, of course, are part of the larger political wars now being fought on an epic scale in the United States. The working poor and the unemployed have effectively been abandoned by both parties and, not without reason, see their country and their rights being taken away by government that has been hijacked by interests beyond their control. And they are very angry. Many see the one government service they thought they had some control over--education--slipping out of their hands, too, and they are determined not to let that happen. I can sympathize with them while at the same time disagreeing vigorously with their premise that the education system was working just fine before the opponents of local control took over. The record shows the system hasn't been working since the 1970s.
Interestingly, these critics on the far right sound to me very much like those on the left. Both seem to believe that all would be well if we rolled the clock back 20 years. But, if we roll the clock back 20 years, what we will find is all the dynamics that produced the mediocre performance and high costs we suffer from now.
We will not find the answers to our declining ranking on the world's education league tables in a romanticized past, or in the market or in disruptive change or in punitive accountability systems or getting rid of our worst teachers. None of the PISA top performers got there with those solutions.
They all got there the old-fashioned way. They invested more in their harder-to-educate students than their easier-to-educate students. They worked hard to make sure that young children and their families had a lot of support before the kids arrived at the school door. They started recruiting their teachers from their most talented high school graduates rather than their least talented graduates. They insisted that all their teachers really master the subjects they would teach and spend at least a year mastering the craft of teaching. They provided an extended period of mentoring for new teachers under the supervision of master teachers. They provided strong support for the continuing development of their existing teaching force. They constructed real career ladders for teachers and paid them well. They wrote very demanding standards for the achievement of their students, incorporating the kinds of skills needed to succeed in the world's most advanced economies, developed a strong curriculum to match those standards and invested in very high quality assessments based on that curriculum. They strengthened their vocational and technical education systems and developed their applied learning systems to provide expanded opportunities for students to enter the adult world with confidence, skill, experiences and connections that would enable them to become productive and fulfilled. Not least important, they provided their ministries of education with the authority and resources they needed to lead and implement this extraordinarily complicated dance.
They neither blew up their system nor did they retreat into the delusion that they could just turn the clock back to get the results they wanted. They did the hard work on the obvious tasks. That is the message of PISA. Will we hear it? Will we act on it?
At Education Next Mike Petrilli identifies The Problem:
PISA and Occam’s Razor
“The United States’ standings haven’t improved dramatically because we as a nation haven’t addressed the main cause of our mediocre PISA performance — the effects of poverty on students,” Dennis Van Roekel, president of the National Education Association, the nation’s largest teachers union, said in a statement. – “American 15-Year-Olds Lag, Mainly in Math, on International Standardized Tests,” by Motoko Rich, New York Times, December 3, 2013Occam’s Razor is the well-known principle that “among competing hypotheses, the hypothesis with the fewest assumptions should be selected.” Keep that in mind today, PISA Day, as various pundits hypothesize about why the U.S. scored below the international average in math, and at the average in reading and science, and why we don’t seem to be making any gains over time on these much-watched gauges.
Dennis Van Roekel offers the poverty hypothesis as an explanation. I’m not unsympathetic to the argument (though America’s child-poverty rate is not as unusual as many people think), but let’s consider all of the assumptions that one must make to support it.
First, one must assume that math is somehow more related to students’ family backgrounds than are reading and science, since we do worse in the former. That’s quite a stretch, especially because of much other evidence showing that reading is more strongly linked to socioeconomic class. It’s well known that affluent toddlers hear millions more words from their parents than do their low-income peers. Initial reading gaps in Kindergarten are enormous. And in the absence of a coherent, content-rich curriculum, schools have struggled to boost reading scores for kids coming from low-income families.
Yet many U.S. schools have succeeded in boosting the math achievement of their low-income students. In fact, the U.S. has shown tremendous progress on NAEP in raising the math scores of poor fourth and eighth graders. (Van Roekel, a former math teacher, should appreciate that.)
So the second assumption must be that “poverty” has a bigger impact on math performance for fifteen-year-olds than for younger students. But I can’t imagine why. If anything, it should have less of an impact, because our school system has had more time to erase the initial disadvantages that students bring with them into Kindergarten.
Furthermore, American performance isn’t just weak among our poorest, lowest-performing students. Our affluent students are mediocre, too. And despite our great wealth, our rate of production of high achievers is barely half that of several other countries. How does “poverty” explain that? One must assume that poverty is diminishing the performance of students who aren’t poor. Hmm.
***
So what’s an alternative hypothesis for the lackluster math performance of our fifteen-year-olds? One in line with Occam’s Razor?
Maybe we’re just not very good at teaching math, especially in high school.
Mike Petrilli over at TB Fordham has made his case for why differences in national economic context do little to substantively explain variations in PISA scores.Petrilli’s Hammer & the poverty has nothing to do with PISA argument
He frames his argument in terms of Occam’s Razor, as if to sound well informed, deeply intellectual and setting the stage to share profound logical argument, summarized as follows:
“among competing hypotheses, the hypothesis with the fewest assumptions should be selected.”Petrilli asserts that while some might perceive a modest association (actually, it’s pretty strong) between national economic context and average tested outcomes in math, for example… like this…
…that it is entirely illogical to assert that child poverty has anything to do with national aggregate differences in math performance at age 15.
That is, the various assumptions that must be made to accept this crazy assertion – that economic context matters in math performance – simply don’t hold water in Petrilli’s mind. Rather, the answer must be much simpler and lie in the classroom, with our good ol’ American ineptitude at teaching math.
As Petrilli concludes in his post:
So what’s an alternative hypothesis for the lackluster math performance of our fifteen-year-olds? One in line with Occam’s Razor?Accepting the bad math teaching conclusion simply requires fewer tricky assumptions than asserting any role for economic context in determining national aggregate outcomes.
Maybe we’re just not very good at teaching math, especially in high school.
Let’s call this Petrilli’s Hammer! as an illogical, blunt & necessarily under-informed alternative to Occam’s Razor. When in doubt – when too lazy to develop disciplined understanding of the field on which you choose to opine and when data are just too hard to handle, get that hammer and everything can look like a nail! (e.g. the bad teacher conclusion)
These two quotes frame Petrilli’s argument:
First, one must assume that math is somehow more related to students’ family backgrounds than are reading and science, since we do worse in the former. That’s quite a stretch, especially because of much other evidence showing that reading is more strongly linked to socioeconomic class. It’s well known that affluent toddlers hear millions more words from their parents than do their low-income peers. Initial reading gaps in Kindergarten are enormous. And in the absence of a coherent, content-rich curriculum, schools have struggled to boost reading scores for kids coming from low-income families.AND
So the second assumption must be that “poverty” has a bigger impact on math performance for fifteen-year-olds than for younger students. But I can’t imagine why. If anything, it should have less of an impact, because our school system has had more time to erase the initial disadvantages that students bring with them into Kindergarten.The problem is that both of these statements are a) conceptually foolish and b) statistically ignorant.
Let’s tackle the second issue conceptually first. These scores for 15 year olds are performance level – or status scores. Status scores reflect the cumulative effects of schooling and family background. Most notably in this case, status scores – math performance at age 15, reflect the cumulative influences of poverty – living in poverty – growing up in poverty – lacking resources over long periods of ones’ early life.
Here’s some more reading on poverty timing and cumulative effects.
And then there’s this report which I prepared last summer with ETS.
So… setting measurement issues aside here, we can logically expect gaps between lower and higher income kids to grow between earlier grade assessments and later grade assessments – if we choose to do little or nothing in policy terms about the circumstances under which these children live. Yes, we can and should leverage resources in schools to offset these gaps. But we’re not necessarily applying those resources either.
Accepting Petrilli’s second point above requires that we ignore entirely that our school system remains vastly disparate in many states and locations between rich and poor communities and reinforces (rather than erasing) the initial disadvantages that students bring with them to Kindergarten.
Now, backing up to his first point, where Petrilli argues that if higher poverty settings/contexts do worse relative to lower poverty settings on math than on reading assessments, there must be a simple answer for the math problem/disparity – like bad math teaching of course. There can be no logical explanation for why math scores might be more sensitive than reading scores to poverty variation. Assuming bad math teaching to be the reason for greater disparity in math than in reading is much simpler than exploring why it might appear that math test scores are more sensitive to context/poverty, etc. than reading scores. This is true because we all know that poverty affects reading more than math – or so Mike says without citation to any legitimate source validating his point.
This one is pretty simple. First, it may simply be the case that Mike Petrilli is wrong on all levels here. That conceptually and statistically, economic deprivation seems to have stronger affect on numeracy than on literacy. But even accepting the idea that poverty affects literacy more – in a substantive way – doesn’t mean that we’d find a stronger statistical relationship between a) variations in poverty across settings and b) variations in measured outcomes across settings. The fact is that variations in math assessments are often simply more predictable. They may be both more stable/consistent and may actually have more variation to predict.
Empirical Illustrations
I’m going to use state level NAEP data within the US here to provide statistical illustrations for the rather simple flat-out-wrongness of Mike Petrilli’s Hammer.
The following illustrations simply reveal how data of this type tend to play out, something anyone reasonably well versed in using assessment data along side economic data, at various levels of aggregation, would understand. Some of these patterns reveal conceptually sound underlying hypotheses, and some may simply be an artifact of typical issues occurring in the measurement of student outcomes at different ages and in different subjects.
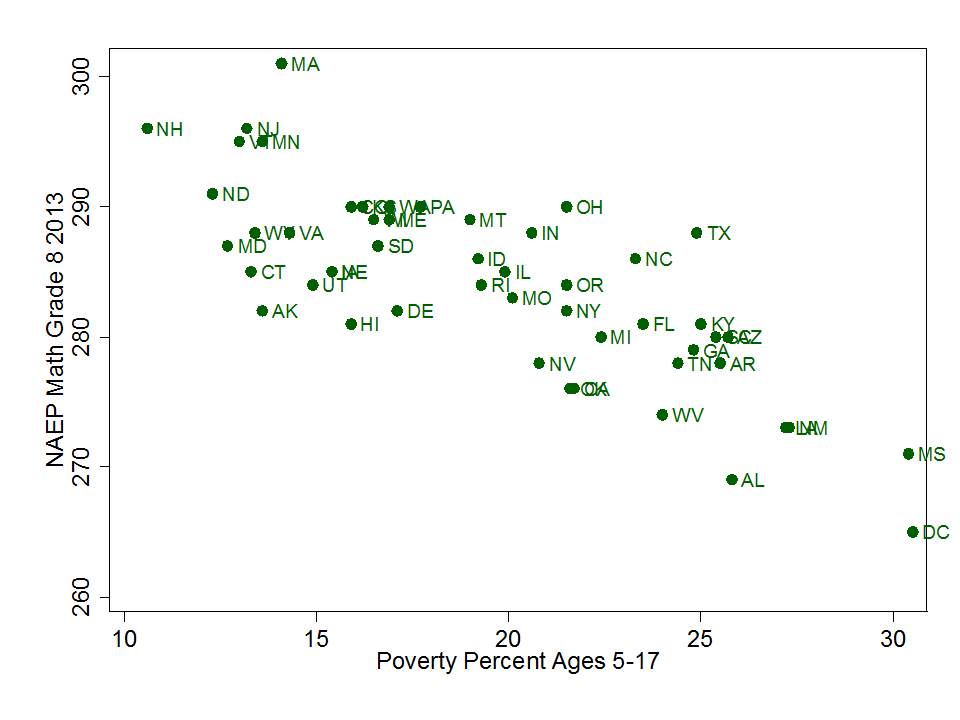
So, for our first question we ask whether it can possibly be the case that there exists greater disparity in math outcomes in 8th grade than in 4th grade across US states of varying degrees of poverty (setting aside the substantive explanations for why such gaps increase).
Now, careful here, this one requires using a little algebra – slope/intercept analysis. The first figure here shows the variation in NAEP math outcomes for 8th graders and for 4th graders, both in 2013.
This figure shows us first of all, that 8th grade math scores are more predictably disparate as a function of poverty than are 4th grade math scores. For 8th grade, poverty alone explains 63% of the cross state variation in math scores, but marginally less (59%) for 4th grade.
The figure also shows us that by 8th grade, an additional 1% poverty is associated with 1.13 point lower state average scale score, whereas in 4th grade, 1% higher poverty rate is associated only with .83 points lower in state average scale score. That is, the negative slope is greater for 8th than for fourth grade.
There can be many, many reasons for this. Among these reasons might be that as time goes on, cumulative poverty related deficits do increase. Persistent disadvantage makes gaps grow. It may also be a measurement issue, pertaining to the precision of measurement of mathematics knowledge and skill, or it may even be an issue of the stability and predictability of tests on early grade math content given to 9 year olds versus tests on stuff like algebra and pre-algebra given to older, hopefully more mature kids (who’ve also taken far more tests by that time).
But, instead of gettin’ all thoughtful about these possibilities and arming ourselves with well-conceived arguments grounded in data and knowledge of the literature, we could simply use Petrilli’s Hammer to assert that the one and only logical answer is that math teachers in high poverty states like Alabama and Mississippi suck and math teachers in low poverty states like New Jersey and Massachusetts rock! It’s bad math teaching that is making this negative slope get worse between grade 4 and grade 8 – bad math teaching exclusively in high poverty states!
Is there greater disparity in Grade 8 Math than in Grade 4 Math by Contextual Poverty?
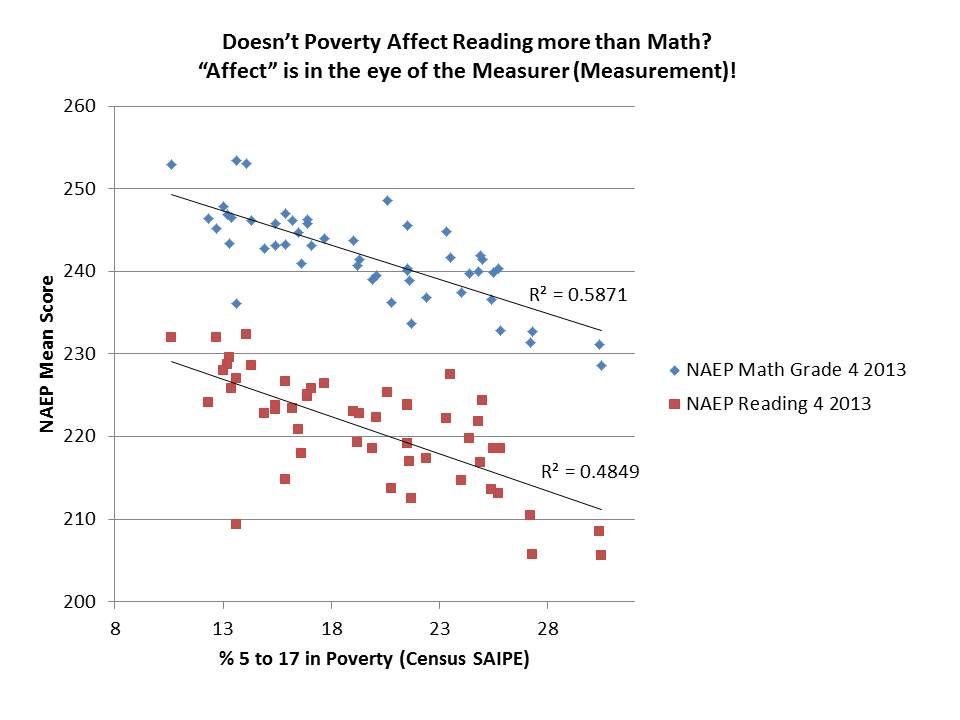
The next question then is how can it ever be that math scores might be more disparate as a function of poverty when we all know that poverty affects reading more?
The next figure shows the relationship between poverty by state, and math and reading scores in grade 4. Rather amazingly, math scores are more predictable as a function of poverty than are reading scores – note the difference in variance explained (r-squared). Now, (almost) anyone who has ever plotted reading and math “level” (status) scores, or even estimated value added scores for reading and math in relation to poverty or nearly any other covariate knows that this is common. Variation in math scores – level or value added – is often much more predictable than is variation in reading scores. As above, this may be for many, many reasons. Maybe we’re just not as good on the measurement side at teasing out differences in underlying skill on reading, with either 9 or 14 year olds?
That math scores are more predictably a function of poverty than reading scores – across states – doesn’t mean that our math teaching is better or worse than our reading teaching. Even though the math scores at 4th grade are more predictable than the reading scores, the reading slope appears slightly more disparate (steeper negative). And that doesn’t mean either that our reading teaching is more disparate, or that the 4th grade scores are picking up some differential on the baggage kids bring to school with them. It’s a statistical artifact of the data – based on how math and reading are being measured. It may mean something, but who knows what? It may mean absolutely nothing.
Are Grade 4 Math Scores more predictably a function of poverty than Grade 4 Reading Scores across contexts?
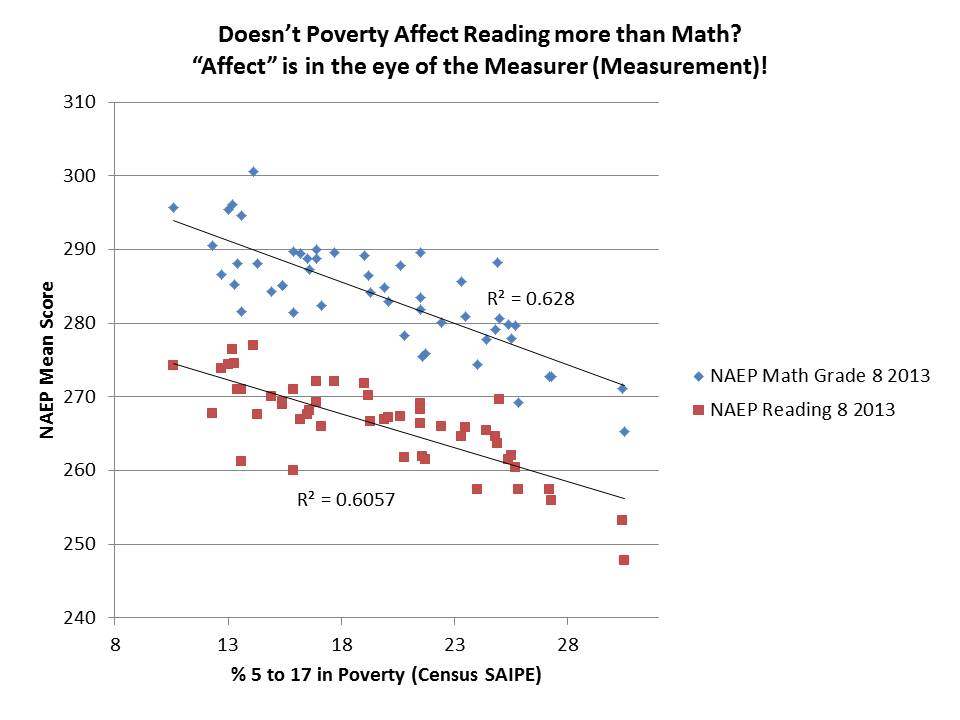
Finally, here’s the 8th grade math and reading. Here, math is marginally more predictable as a function of poverty and math outcomes are more disparate as a function of poverty.
At least by these measures – NAEP math and reading scores – aggregated to the state level – which is similar to making national comparisons – reading is NOT as Petrilli so confidently argues above “more strongly linked to socioeconomic class” than math.
International comparisons work much the same.
What about Grade 8 Math and Reading?
Indeed, Petrilli is attempting to assert that there exists an incongruity between the data and the underlying reality – that yes, reading scores are affected by poverty, but math not so much. Thus, if the data show that math scores are more affected by poverty than are reading scores, then something much more nefarious must be going on – Yes – the bad teacher/teaching problem!
It couldn’t possibly have anything to do with measurement issues or the significant possibility that the full range of student outcomes measured are similarly affected by economic deprivation. That would just be way too much to swallow.
But, if we want to go there… if we want to accept Petrilli’s argument that there’s simply no excuse for U.S. students to fall where they do on international math comparisons, because poverty doesn’t affect 15 year olds or math, only younger kids and reading, then we must apply Petrilli’s hammer to state-by-state comparisons as well.
And thus we logically conclude that math teaching in DC, MS, AL, LA stink and math teaching in NJ, MA VT and NH is great! And that poverty really has nothing to do with it?

1 comment:
I think if folks will check the U.S. ranking since they started doing this comparison, they will find that we have always been in the middle of the pack. Somewhere along the line we have fooled ourselves in to thinking we were ever at the head of the pack.
I recognize the connection between student SES and achievement but as a kid from the 60's who was raised in a pretty blue collar home in Kentucky, I would have to say that what some folks consider to be poverty these days is probably a little different than what we considered economic distress forty or fifty years ago. Seems like our school provide a lot more support and services (formal and informal) than I recall back in the day.
Further, having traveled in Europe and Asia, I find it hard to see how one can attempt to make SES comparisons between poor in China, Japan, Hong Kong, Germany, Switzerland and the United States. Very different places, expectations and living conditions as well as school systems.
I'm just not so sure I can buy into making long term comparisons about poverty in relationship to different time periods or cultures. Maybe I am just tired of educational leaders who for decades have tried to motivate (control)educators with fear (Sputnik, Nation at Risk, Etc)and politicians who don't seem to have the slightest idea about how to foster a growing economy beyond their own personal and party bank accounts.
Post a Comment