This from School Finance 101:
Knowing that I’ve been writing a fair amount about various methods for attributing student achievement to their teachers, several colleagues forwarded to me the recently released standards of the Council For the Accreditation of Educator Preparation, or CAEP. Specifically, several colleagues pointed me toward Standard 4.1 Impact on Student Learning:
4.1.The provider documents, using value-added measures where available, other state-supported P-12 impact measures, and any other measures constructed by the provider, that program completers contribute to an expected level of P-12 student growth.Now, it’s one thing when relatively under-informed pundits, think tankers, politicians and their policy advisers pitch a misguided use of statistical information for immediate policy adoption. It’s yet another when professional organizations are complicit in this misguided use. There’s just no excuse for that! (political pressure, public polling data, or otherwise)
http://caepnet.org/commission/standards/standard4/
The problems associated with attempting to derive any reasonable conclusions about teacher preparation program quality based on value-added or student growth data (of the students they teach in their first assignments) are insurmountable from a research perspective.
Worse, the perverse incentives likely induced by such a policy are far more likely to do real harm than any good, when it comes to the distribution of teacher and teaching quality across school settings within states.
First and foremost, the idea that we can draw this simple line below between preparation and practice contradicts nearly every reality of modern day teacher credentialing and progress into and through the profession:
one teacher prep institution –> one teacher –> one job in one school –> one representative group of studentsThe modern day teacher collects multiple credentials from multiple institutions, may switch jobs a handful of times early in his/her career and may serve a very specific type of student, unlike those taught by either peers from the same credentialing program or those from other credentialing programs. This model also relies heavily on minimal to no migration of teachers across state borders (well, either little or none, or a ton of it, so that a state would have a large enough share of teachers from specific out of state institutions to compare). I discuss these issues in earlier posts.
Setting aside that none of the oversimplified assumptions of the linear diagram above hold (a lot to ignore!), let’s probe the more geeky technical issues of trying to use VAM to evaluate ed school effectiveness.
There exist a handful of recent studies which attempt to tease out certification program effects on graduate’s student’s outcomes, most of which encounter the same problems. Here’s a look at one of the better studies on this topic.
Specifically, this study tries to tease out the problem that arises when graduates of credentialing programs don’t sort evenly across a state. In other words, a problem that like ALWAYS occurs in reality!
- Mihaly, K., McCaffrey, D. F., Sass, T. R., & Lockwood, J. R. (2012). Where You Come From or Where You Go?
Researchy language likes to downplay these problems by phrasing them only in technical terms and always assuming there is some way to overcome them with statistical tweak or two. Sometimes there just isn’t and this is one of those times!
Let’s dig in. Here’s a breakdown of the abstract:
In this paper we consider the challenges and implications of controlling for school contextual bias when modeling teacher preparation program effects. Because teachers from any one preparation program are hired in more than one school and teachers are not randomly distributed across schools, failing to account for contextual factors in achievement models could bias preparation program estimates.Okay, that’s a significant problem! Teachers from specific prep institutions are certainly not likely to end up randomly distributed across a state, are they? And if they don’t, the estimates of program effectiveness could be “biased.” That is, the estimates are wrong! Too high, or to low, due to where their grads went as opposed to how “good” they were. Okay, so what’s the best way to fix that, assuming you can’t randomly assign all of the teacher grads to similar schools/jobs?
Including school fixed effects controls for school environment by relying on differences among student outcomes within the same schools to identify the program effects. However, the fixed effect specification may be unidentified, imprecise or biased if certain data requirements are not met.That means, that the most legit way to compare teachers across programs is if you can compare teachers whose first placements are in the same schools, and ideally where they serve similar groups of kids. And, you’d have to have a large enough sample size at the lowest level of analysis – comparable classrooms within school – to accomplish this goal. So, the best way to compare teachers across prep programs is to have enough of them, from each and every program, in each school, teaching similar kids similar subjects at the same grade level, across grade levels. Hmmmm…. How often are we really likely to meet this data requirement?
Using statewide data from Florida, we examine whether the inclusion of school fixed effects is feasible in this setting, the sensitivity of the estimates to assumptions underlying for fixed effects, and what their inclusion implies about the precision of the preparation program estimates. We also examine whether restricting the estimation sample to inexperienced teachers and whether shortening the data window impacts the magnitude and precision of preparation program effects. Finally, we compare the ranking of preparation programs based on models with no school controls, school covariates and school fixed effects. We find that some preparation program rankings are significantly affected by the model specification. We discuss the implications of these results for policymakers.With “no school” controls means not accounting at all for differences in the schools where grads teach. With “covariates” means correcting in the model for the measured characteristics of the kids in the schools – so – trying to compare teachers who teach in similar – by measured characteristics – schools. But, measured characteristics often really fail to catch all the substantive differences between schools/classrooms. And where “school fixed” effects means comparing graduates from different institutions who teach in the same school (though not necessarily the same types of kids!).
Okay, so the authors tested their “best” methodological alternative (comparing teachers within schools, by school “fixed” effect) with other approaches, including making no adjustment for where teachers went, or making adjustments based on the characteristics of the schools, even if not matched exactly.
The authors found that the less good alternatives were, to no surprise, less good- potentially biased. The assumption being that the fixed effect models are most correct (which doesn’t, however, guarantee that they are right!).
So, if one can only most legitimately compare teacher prep programs in cases where grads across programs are concentrated in the same schools for their first jobs, that’s a pretty severe limitation. How many job openings are there in a specific grade range in a specific school in a given year – or even over a five year period? And how likely is it that those openings can be filled with one teacher each from each teacher prep institution. But wait, really we need more than one from each to do any legit statistical comparison – and ideally we need for this pattern to be replicated over and over across several schools. In other words, the constraint imposed to achieve the “best case” model in this study is a constraint that is unlikely to ever be met for more than a handful of large teacher prep institutions concentrated in a single metropolitan area (or very large state like Florida).
Other recent studies have not found VAM particularly useful in parsing program effects:
We compare teacher preparation programs in Missouri based on the effectiveness of their graduates in the classroom. The differences in effectiveness between teachers from different preparation programs are very small. In fact, virtually all of the variation in teacher effectiveness comes from within-program differences between teachers. Prior research has overstated differences in teacher performance across preparation programs for several reasons, most notably because some sampling variability in the data has been incorrectly attributed to the preparation programs.Koedel, C., Parsons, E., Podgursky, M., & Ehle, M. (2012). Teacher Preparation Programs and Teacher Quality: Are There Real Differences Across Programs? (No. 1204).
http://econ.missouri.edu/working-papers/2012/WP1204_koedel_et_al.pdf
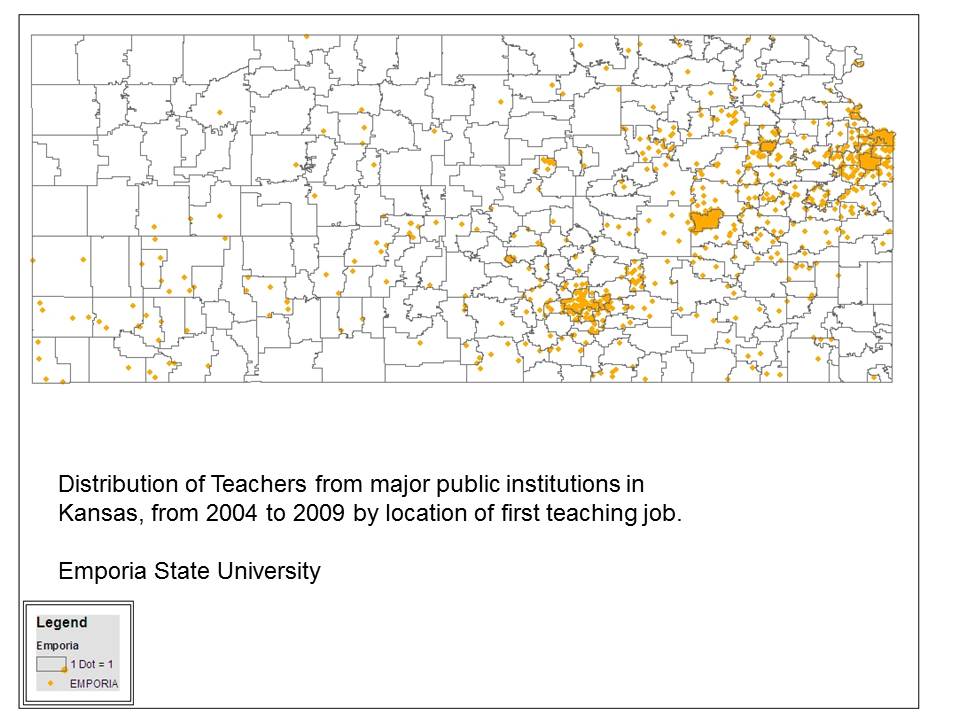
Example from Kansas
Let’s use the state of Kansas and graduates over a five year period from the state’s major teacher producing institutions to see just how problematic it is to assume that teacher preparation institutions in a given state will produce sufficient numbers of teachers who teach in the same schools as graduates of other programs.
All programs
Specific programs
Indeed, the overlap in more population dense states may be more significant, but still unlikely sufficient to meet the high demands of the fixed effects specification (where you can only essentially compare when you have graduates of different programs working in the same school together, in similar assignments… presumably similar number of years out of their prep programs).
Strategically Gaming Crappy, Biased Measures of “Student Growth”
In practice, I doubt most schools of ed, or state education agencies will actually consider how to best model program effectiveness with these measures. They likely won’t even bother with this technically geeky question of the fixed effects model, and data demands to apply that model. Rather, they’ll be taking existing state provided growth scores or value-added estimates and aggregating them across their graduates.
Given the varied, often poor quality of state adopted metrics, the potential for CAEP Standard 4.1 to decay into absurd gaming is quite high. In fact, I’ve got a gaming recommendation right here for teacher preparation institutions in New York State.
We know from the state’s own consultant analyzing the growth percentile data that:
Despite the model conditioning on prior year test scores, schools and teachers with students who had higher prior year test scores, on average, had higher MGPs. Teachers of classes with higher percentages of economically disadvantaged students had lower MGPs. (p. 1) http://schoolfinance101.files.wordpress.com/2012/11/growth-model-11-12-air-technical-report.pdfWe also know from this same technical report that the bias appears to strengthen with aggregation to the school level. It may also strengthen with aggregation across similar schools. And this is after conditioning the model on income status and disability status.
As such, it is in the accreditation interest of any New York State teacher prep institution to place as many grads as possible into lower poverty schools, especially those with fewer children with disabilities. By extension, it is therefore also in the accreditation interest of NY State teacher prep institutions to reduce the numbers of teachers they prepare in the field of special education. As it turns out, the New York State growth percentiles are also highly associated with initial scores – higher initial average scores are positively associated with higher growth. So, getting grads into relatively higher performing schools might be advantageous.
With a little statistical savvy, a few good scatteplots, one can easily mine the biases of any state’s student growth metrics to determine how to best game them in support of CAEP standard 4.1.


Further, because it is nearly if not entirely impossible to use these data to legitimately compare program effects, the best one can do is to find the most advantageous illegitimate approach.
Are these really the incentives we’re looking for?
No comments:
Post a Comment